
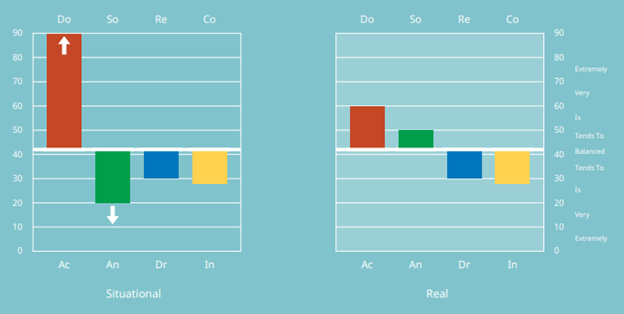
The situational graph displays how the respondent is currently behaving and represents a snapshot in time, when they took the assessment. If there are arrows on the situational graph, the individual is behaving far outside of their natural personality. If there are no arrows on the situational graph, the respondent is not making any significant situational adjustments.
In contrast, the real graph displays their natural personality, which is stable over time.
The situational graph only appears on Word Survey results.
If there are arrows on the situational side, the goal is to uncover why the respondent is behaving outside of their natural temperament to:
- In the hiring phase – understand whether they will have to continue to make those same adjustments in the role that you are looking to fill and what the implications of maintaining those behaviours are.
- Post hire – understand whether changes need to be made to an employee’s role, work relationships or other factors in order to allow them to behave more in-line with their natural personality. Note: if the employee completed the assessment prior to the current time frame, the situational graph would no longer be relevant. If the goal is to analyze their current situation, the assessment should be retaken.
To understand what situational adjustments are being made, focus on which direction each arrow is pointing. As each trait scale has 2 opposite traits, there are 2 ways of describing each adjustment.
- If the arrow is pointing towards the top of the graph, it can be described as the respondent is behaving more [insert trait at the top of the graph] or less [insert trait at the bottom of the graph].
- If the arrow is pointing towards the bottom of the graph, it can be described as the respondent is behaving more [insert trait at the bottom of the graph] or less [insert trait at the top of the graph].
For example:
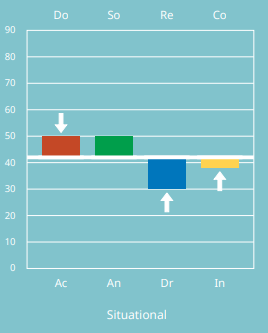
The respondent below is behaving more dominant or less accepting than is natural for them. This is because the arrow is pointing towards the dominant trait and away from the accepting trait.
The respondent below is also behaving more analytical or less sociable than is natural for them. This is because the arrow is pointing towards the analytical trait and away from the sociable trait.
There are 2 patterns commonly found on the situational graph: Stretching and Holding Back. If the situational graph does not meet the specific criteria of either stretching or holding back, the respondent does not fall into 1 of these 2 patterns and is simply making some other situational adjustment.
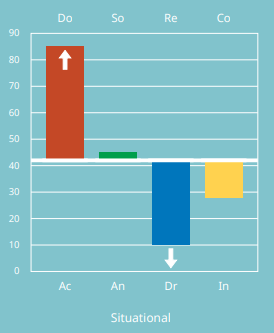
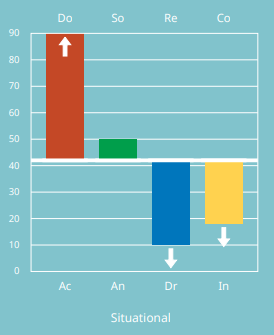
Common situational graph pattern: Stretching
A situational graph is stretching when it meets both of the following 2 conditions:
- Condition 1: Arrow is pointing up towards the dominance trait
- Condition 2: Arrow is pointing down towards the driving trait OR arrow is pointing down towards the independent trait OR there are two arrows pointing down towards the driving and independent traits
Another way of wording the above conditions is:
- Condition 1: The respondent is behaving more dominant than is natural for them
- Condition 2: The respondent is behaving more driving OR more independent OR both more driving and independent than is natural for them
The following situational graphs all represent the stretching pattern:

Common reasons why a respondent might be stretching are as follows:
- They are in a demanding role or experiencing an increase in responsibilities
- They are under pressure to improve their performance
- They are trying to demonstrate leadership qualities
Note: The goal in a hiring process is to uncover why the candidate is stretching in their current role and if it will continue to happen in the role that you are looking to fill. If the candidate will have to continue to stretch in the role that you are looking to fill, the question that you are trying to evaluate is: is this adjustment sustainable?
The goal when looking at the results of an existing employee – if the assessment was done recently as the situational graph represents a snapshot in time – is to uncover why the employee is stretching and what actions can be taken to allow them to behave more in line with their natural personality.
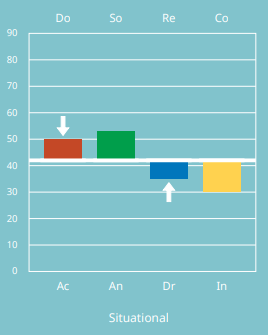
Common situational graph pattern: Holding Back
A situational graph is holding back when it meets both of the following 2 conditions:
- Condition 1: Arrow is pointing down towards the accepting trait
- Condition 2: Arrow is pointing up towards the relaxed trait OR arrow is pointing up towards the compliant trait OR there are two arrows pointing up towards the relaxed and compliant traits
Another way of wording the above conditions is:
- Condition 1: The respondent is behaving more accepting than is natural for them
- Condition 2: The respondent is behaving more relaxed OR more compliant OR both more relaxed and compliant than is natural for them
The following situational graphs all represent the holding back pattern:

Common reasons why a respondent might be holding back are as follows:
- They are feeling underutilized
- They are feeling disengaged due to recent developments
- They are easing up for fear of being too domineering
Note: The goal in a hiring process is to uncover why the candidate is holding back in their current role and if it will continue to happen in the role that you are looking to fill. If the candidate will have to continue to hold back in the role that you are looking to fill, the question that you are trying to evaluate is: is this adjustment sustainable?
The goal when looking at the results of an existing employee – if the assessment was done recently as the situational graph represents a snapshot in time – is to uncover why the employee is holding back and what actions can be taken to allow them to behave more in line with their natural temperament.
Comments
0 comments
Please sign in to leave a comment.